One of the best ways to understand the workings of an application is to trace the interaction between the application and the database. For SQL Server-based applications, the SQL Server Profiler is the tool that allows you to peek behind the scenes.
By default, the Profiler only lists the the stored procedures that the application calls directly. For example, if the application calls a Level1 stored procedure, you will see this in the Profiler results:
For the most part, I find to be sufficient to get a handle on what is going on. But there will be those times where you would want to dig deeper and trace into the individual lines inside the stored procedure..
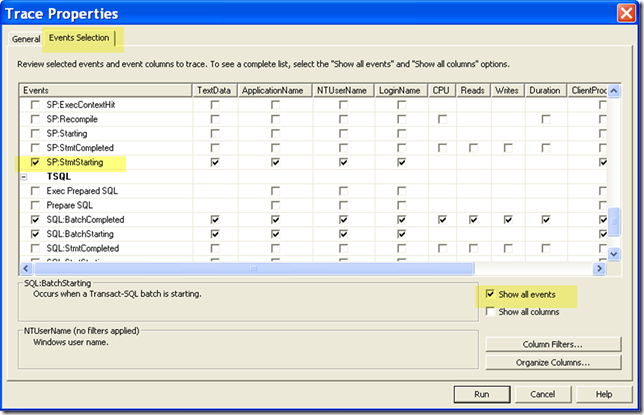
To do this:
- Go to the Properties window
- Go to the Event Selection tab.
- Check Show All Events
- Check the SP:StmtStarting event inside the Stored Procedure group.
After you Click on Run and let your application execute, you will see the individual line statements in the stored procedure and anything else it may call.


No comments:
Post a Comment